
Let’s face it – getting people to complete surveys feels like pulling teeth sometimes. You send out hundreds of survey invitations, and what comes back? A handful of responses that barely scratch the surface of what you need. If you’re nodding your head right now, you’re not alone. Low survey response rates are one of the biggest headaches for businesses trying to understand their customers better.
But here’s the good news: a simple redesign of your survey can completely change the game. In this case study, we’ll walk through how one company transformed their survey response rates from a disappointing 12% to an impressive 52% – and how you can apply these same strategies to your own surveys.
Table of Contents
Where Everything Went Wrong?
Our client, a mid-sized software company, came to us with a problem that might sound familiar. They were sending quarterly customer satisfaction surveys to their user base of 5,000 customers. Despite offering incentives and sending multiple reminder emails, they were stuck at a 12% response rate. That’s only 600 responses from their entire customer base.
The leadership team was frustrated. They needed customer feedback to make important product decisions, but the data they were getting wasn’t representative enough. Something had to change.
Identifying the Real Problems
Before jumping into solutions, we spent time understanding why people weren’t completing the survey. We conducted quick phone interviews with customers who had abandoned the survey halfway through. The feedback was eye-opening:
Problem #1: The Survey Was Too Long
The original survey had 45 questions. Most people gave up after question 15.
Problem #2: Questions Were Confusing
Many questions used technical jargon and complex rating scales that made respondents think too hard.
Problem #3: No Clear Purpose
Customers didn’t understand why their feedback mattered or how it would be used.
Problem #4: Poor Mobile Experience
Over 60% of respondents were trying to complete the survey on their phones, but it wasn’t mobile-friendly.
Problem #5: Bad Timing
Surveys were sent on Monday mornings when people were busiest.

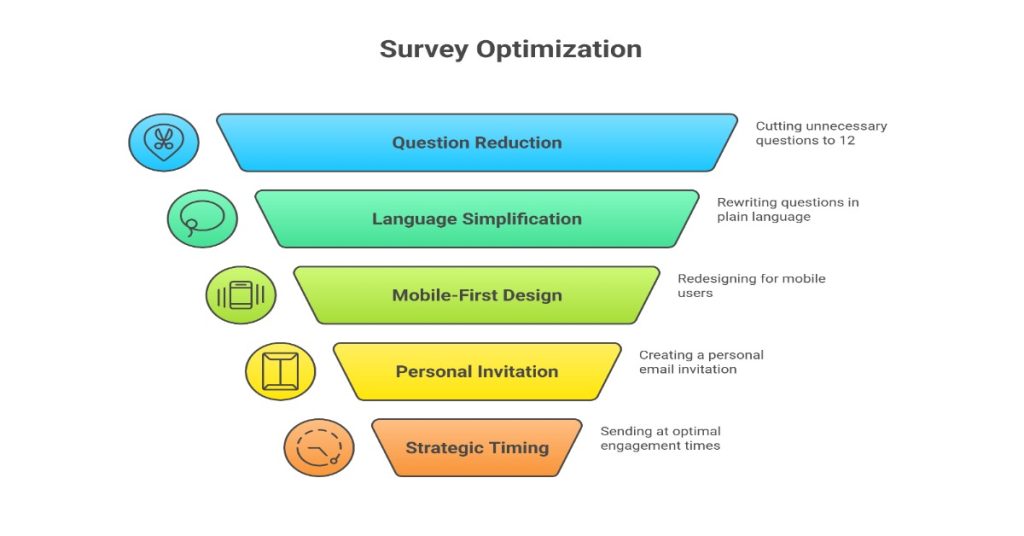
The Transformation: What We Changed
Making Every Question Count
The first step was brutal but necessary – we cut the survey from 45 questions down to just 12. How? By asking ourselves one simple question for each item: “Will this answer directly impact a business decision?” If the answer was no, the question got cut.
We also grouped similar questions together. Instead of asking five different questions about customer support, we created one smart question with sub-options that appeared only if relevant.
Speaking Human Language
Technical terms and industry jargon got the boot. We rewrote every question in plain, conversational language. For example:
Before: “Rate your satisfaction with our API documentation comprehensiveness”
After: “How helpful do you find our setup guides and technical docs?”
We also simplified the rating scales. Instead of a complex 10-point scale, we moved to a simple 5-point scale with clear labels like “Very Helpful,” “Somewhat Helpful,” and “Not Helpful.”
Creating a Mobile-First Design
Since most people were taking the survey on their phones, we redesigned everything with mobile users in mind. This meant:
- Bigger buttons that were easy to tap
- One question per screen on mobile devices
- Auto-advancing to the next question after an answer
- A progress bar showing how much was left
Adding the Human Touch
We completely rewrote the survey invitation email. Instead of a formal, corporate message, we created something that felt personal and genuine. The email now:
- Started with a friendly greeting
- Explained exactly how the feedback would be used
- Mentioned specific improvements made from previous surveys
- Included an honest estimate of completion time (3 minutes)
- Came from a real person’s email address, not a no-reply address
Timing Is Everything
After analyzing email open rates and response patterns, we discovered that Thursday afternoons between 2-4 PM had the highest engagement. We also learned that sending a gentle reminder three days later (on Sunday evening) caught people when they had more free time.
The Smart Details That Made a Difference
Progress Indicators That Actually Work
Instead of just showing “Question 3 of 12,” we added time-based progress indicators: “About 2 minutes left.” This small change reduced abandonment rates significantly because people could see the finish line.
The Power of Optional Questions
We made demographic questions optional and placed them at the end. This way, even if someone skipped them, we still got their core feedback. Previously, required demographic questions at the beginning were causing immediate drop-offs.
Smart Branching Logic
Not every question applied to every customer. We implemented branching logic so people only saw relevant questions. If someone said they hadn’t used customer support, they wouldn’t see three questions about support quality.
The Thank You That Matters
- After submission, instead of a generic “Thank you” page, respondents saw:
- A genuine thank you message
- A summary of what would happen with their feedback
- A timeline for when changes might be implemented
- An option to see previous improvements based on survey feedback
The Results: Numbers Don’t Lie
After implementing these changes, the results exceeded our expectations:
- Response rate jumped from 12% to 52% (333% increase)
- Completion rate increased from 67% to 94% (for those who started the survey)
- Average completion time dropped from 18 minutes to 3 minutes
- Mobile completion rates increased from 23% to 71%
Quality of responses improved with more detailed comments in open-ended questions
But the benefits went beyond just numbers. The company now had statistically significant data from their customer base. They could make confident decisions about product features, identify real pain points, and track satisfaction trends over time.

Key Takeaways You Can Apply Today
Start With Empathy
Put yourself in your respondent’s shoes. Would you want to answer 45 questions on your phone during a busy Monday morning? Probably not.
Less Is More
Every additional question reduces your response rate. Be ruthless about cutting unnecessary questions. If you can’t explain how you’ll use the data from a question, remove it.
Test on Multiple Devices
Before sending your survey, test it on different devices. What looks great on your laptop might be a nightmare on a smartphone.
Write Like You Talk
Ditch the formal language and write your questions the way you’d ask them in a conversation. Your respondents will appreciate the clarity.
Show Respect for Time
Be honest about how long the survey takes. If you say “2 minutes” and it takes 15, you’ve lost trust and future participation.
Close the Loop
Tell respondents what happened with previous feedback. When people see their input creates real change, they’re more likely to participate again.
Read More
10 Question Types That Drive Higher Survey Completion Rates

Get Better Feedback: How to Use Open-Ended Questions in Your Surveys?

The Role of Random Sampling in Ensuring Survey Accuracy Online
Your Next Steps
Ready to transform your own survey response rates? Start small. Pick one upcoming survey and apply just three of these changes. Measure the difference, learn what works for your audience, and build from there.
Remember, every percentage point increase in your response rate means more voices heard and better data for decision-making. Your customers want to share their opinions – you just need to make it easy and worthwhile for them to do so.
The path from 12% to 52% response rates wasn’t magic. It was thoughtful design, respect for respondents’ time, and a genuine commitment to making surveys better. The same transformation is waiting for your surveys. The question is: are you ready to make it happen?