
You’ve done it. You’ve spent weeks crafting the perfect online survey. You’ve written sharp questions, designed a clean interface, and sent it out to your audience. The responses are rolling in, and you’re excited to see what the data says about your new product idea, customer satisfaction, or market trends.
But then, a nagging feeling creeps in. Do these results really reflect what your entire customer base thinks? You notice that most of the respondents are from one specific age group, or maybe they are all your most recent customers. Suddenly, the confidence you had in your data starts to waiver. You’re worried that the decisions you make based on this survey might be built on a shaky foundation.
Table of Contents
This is a common pain point for anyone who runs online surveys. That gap between what your survey sample says and what your total population actually believes is called sampling error. It’s the reason why a survey of 500 people might show 60% approval for a feature, while the “true” number among all your users is actually 52%. A small difference? Maybe. But what if that 8% difference is the deciding factor in a multi-million-dollar investment?
Getting this right is critical. The good news is that sampling error isn’t a monster you have to hide from. It’s a natural part of surveying, and with the right strategies, you can manage it, reduce it, and understand its impact.
This guide is for you if you’ve moved past the basics and want to learn advanced, practical ways to make your survey data more reliable. We’ll walk through what sampling error really is, why it happens, and introduce powerful methods to give you more confidence in your results.
First, What Exactly Is Sampling Error? (And What It Isn’t)
Let’s get on the same page. Imagine you want to know the average opinion of a giant pot of soup. You can’t eat the whole pot, so you take a spoonful to taste it.
Sampling error is the chance that your single spoonful isn’t a perfect representation of the entire pot. Maybe you accidentally got more carrots in your spoonful than the soup as a whole contains. Your sample (the spoonful) is slightly different from the total population (the pot of soup).
In the world of online surveys, your “population” is the entire group you want to understand (e.g., all your customers, all potential buyers in a region, all your employees). Your “sample” is the smaller group of people from that population who actually take your survey. Sampling error is the statistical uncertainty that arises because you’re only looking at a piece of the whole picture.
It’s important to distinguish this from non-sampling errors. These are mistakes related to the survey design or process itself, such as:
- Poorly worded questions: Leading or confusing questions that influence answers.
- Response bias: People not answering truthfully, perhaps to seem more socially acceptable.
- Data entry mistakes: Typos and errors when processing the data.
While these are also serious problems, our focus today is specifically on the errors that come from the act of sampling itself.

Why Does Sampling Error Creep into Online Surveys?
Understanding the cause of a problem is the first step to fixing it. Sampling error in online surveys typically comes from a few key sources. Do any of this sound familiar?
Your Sample Size Isn’t Right
This is the most obvious one. If your pot of soup has 10,000 liters, a tiny drop isn’t going to tell you much. Similarly, if your customer base is 50,000 people, a survey with only 50 responses is highly susceptible to random chance. A small sample size increases your margin of error, which is a number that quantifies the sampling error. A larger sample size generally reduces this error, but there’s a point of diminishing returns. Going from 100 to 1,000 respondents makes a huge difference; going from 10,000 to 11,000, not so much.
You’re Using a Non-Representative Sample
This is the most dangerous and common pain point. This happens when the characteristics of your survey respondents don’t match the characteristics of your total population.
Imagine you’re a clothing brand and you send a survey link in your monthly newsletter. The people who open that newsletter, click the link, and complete the survey are likely your most engaged customers. Your results will show glowing reviews and high brand loyalty. But you’ve completely missed out on hearing from casual buyers or, more importantly, people who have stopped buying from you. Your sample is biased, and the data, while positive, is misleading.
Your Sampling Method is Flawed
How you pick people for your survey matters immensely. Many people default to convenience sampling—surveying whoever is easiest to reach. This could be posting a link on your social media page or sending it to an email list. While easy, this method almost guarantees a non-representative sample. You’re not actively selecting a sample that mirrors your population; you’re just taking what you can get. This introduces significant risk of error.

Advanced Sampling Methods to Reduce Error
If you’re relying on just simple random sampling (where everyone has an equal chance of being picked) or, worse, convenience sampling, you’re leaving a lot of accuracy on the table. Here are some more advanced methods that give you greater control.
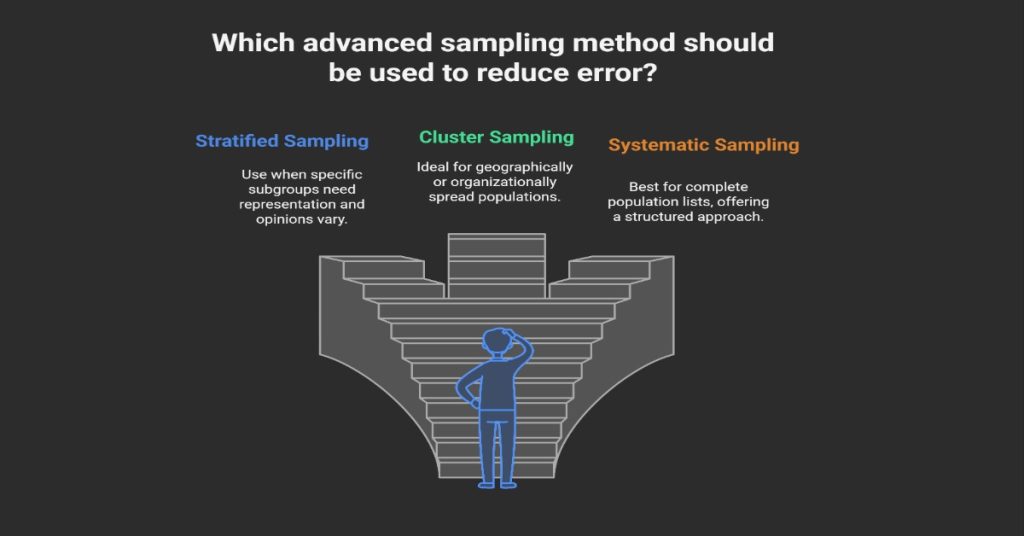
1. Stratified Sampling
What it is: Stratified sampling is a method where you divide your population into smaller, distinct subgroups, or “strata.” Then, you perform a simple random sample within each subgroup. The key is that these subgroups are mutually exclusive and cover the entire population.
When to use it: Use this when you have specific subgroups within your population that you need to be represented correctly. It’s perfect when you know that certain groups will have different opinions.
A practical example:
Let’s say a software company wants to survey its 10,000 users about a potential new pricing model. They know their users fall into three tiers:
- Free users (7,000 people, or 70%)
- Standard plan users (2,500 people, or 25%)
- Premium plan users (500 people, or 5%)
If they just sent a random survey, they might get very few responses from the small but valuable group of premium users. Their voices would be drowned out.
With stratified sampling, they decide they want a total sample size of 400 people. They would sample proportionally from each stratum:
- Free users: 70% of 400 = 280 users randomly selected from this group.
- Standard users: 25% of 400 = 100 users randomly selected from this group.
- Premium users: 5% of 400 = 20 users randomly selected from this group.
Now, their final sample of 400 people perfectly mirrors the company’s user base structure. The conclusions drawn are far more likely to be accurate for the entire population.

2. Cluster Sampling
What it is: In cluster sampling, you divide the population into multiple groups, known as clusters. Instead of sampling individuals, you randomly select entire clusters to survey. Everyone within the selected clusters is included in the sample.
When to use it: This method is extremely useful when your population is geographically or organizationally spread out, making it difficult or expensive to sample individuals.
A practical example:
A national retail chain wants to survey its store employees about workplace satisfaction. They have 300 stores across the country. Surveying a random sample of employees from every single store would be a logistical nightmare.
Instead, they can treat each store as a cluster. Using cluster sampling, they could:
- List all 300 stores (the clusters).
- Randomly select 25 stores.
- Survey every single employee within those 25 selected stores.
This is much more manageable. However, be aware: cluster sampling can introduce more error than stratified sampling if the clusters themselves are very different from one another. For instance, if city stores are very different from rural stores, you’d want to make sure you randomly select a mix of both.
3. Systematic Sampling
What it is: Systematic sampling is a simpler but more structured alternative to simple random sampling. You start by picking a random starting point in your population list and then select every “nth” person on the list.
When to use it: This is a great choice when you have a complete list of your population, like an email list or customer database. It gives a good spread across the entire list and is often easier to execute than simple random sampling.
A practical example:
You have a customer email list of 20,000 people and you want a sample of 500.
- First, you calculate your sampling interval: 20,000 (population) / 500 (sample size) = 40. Your interval is 40.
- You choose a random starting number between 1 and 40. Let’s say you pick 17.
- Your first selected person is the 17th person on the list.
- Your next one is person #57 (17 + 40), then person #97 (57 + 40), and so on, until you have 500 people.
The only risk here is if your list has a hidden pattern that aligns with your interval. For example, if your list is organized by family and every 40th person is the head of a household, your sample would be biased. But in most digitally-managed lists, this is rarely an issue.
Post-Survey Strategies to Correct for Error
Even with the best sampling methods, your final respondent pool might not be a perfect mirror of your population. People are busy, and not everyone you invite will respond. This is where non-response bias comes in—the people who answered your survey might be fundamentally different from those who didn’t.
Luckily, you have powerful techniques to adjust your data after it’s collected.
The Power of Weighting
What it is: Weighting is a statistical adjustment you make to your data to correct for imbalances in your sample. You give more “weight” to responses from underrepresented groups and less “weight” to responses from overrepresented groups.
How it works: Let’s go back to our software company example. Suppose that despite using stratified sampling, their final respondents were 60% free users, 35% standard users, and only 5% premium users. Their target was 70%, 25%, and 5%. The standard users are overrepresented, and the free users are underrepresented.
To fix this, they can apply a weight to each response:
- Free users: They make up 70% of the population but only 60% of the sample. The weight for them would be 70/60 ≈ 1.17. Each response from a free user is counted as 1.17 responses.
- Standard users: They make up 25% of the population but 35% of the sample. Their weight would be 25/35 ≈ 0.71. Each response from this group is counted as less than a full response.
- Premium users: They make up 5% of the population and 5% of the sample. Their weight is 5/5 = 1. Their responses are counted as-is.
After weighting, the adjusted results will now accurately reflect the proportions of the true population. Most advanced survey analysis tools offer features to apply these weights.
Analyzing Non-Response Bias
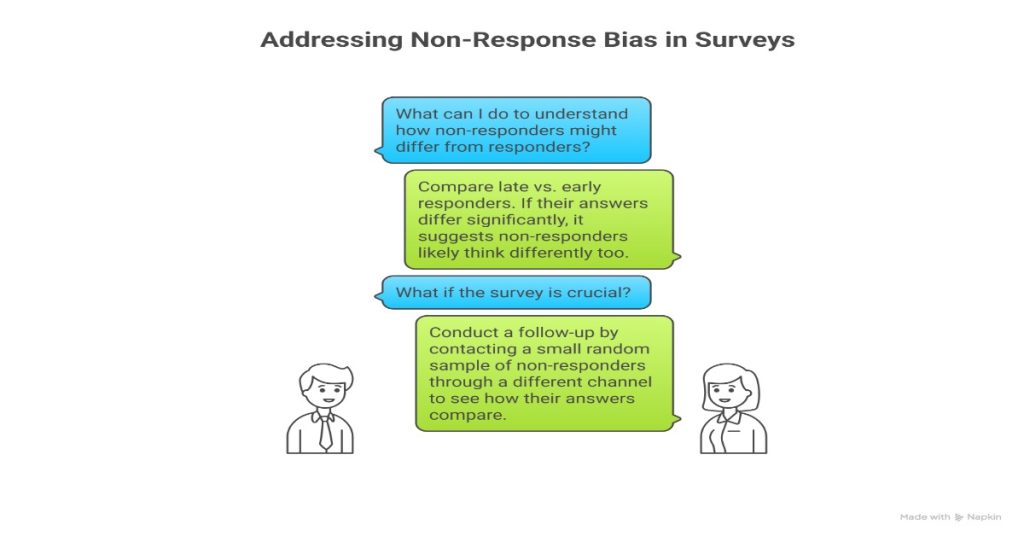
It’s tempting to ignore the people who didn’t answer, but they hold valuable clues. To manage non-response bias, you can:
- Compare late vs. early responders: Often, people who respond late to a survey (after a few reminders) are more similar to non-responders than those who answered right away. If your late responders have very different answers from your early ones, it’s a red flag that your non-responders likely think differently too.
- Conduct a follow-up: For a mission-critical survey, you can take a small random sample of the non-responders and try to contact them through a different channel (e.g., a phone call). If you can get even a few to answer a couple of key questions, you can see how different their answers are from your main respondent pool.
Your Action Plan for Better Survey Data
Feeling overwhelmed? Let’s turn this into a straightforward action plan.
- Define Your Population First: Before you write a single question, be crystal clear about who you want to hear from. Is it “all website visitors” or “all customers who have purchased in the last year”? Be specific.
- Choose the Right Sampling Method: Don’t just default to convenience. Look at your population. Is it made up of distinct groups? Use stratified sampling. Is it geographically dispersed? Consider cluster sampling. Do you have a clean list? Systematic sampling is a strong choice.
- Calculate Your Sample Size: Use an online sample size calculator. You’ll need to know your population size, your desired margin of error (usually ~5%), and your confidence level (usually 95%). This will tell you how many responses you need to be statistically sound.
- Execute and Monitor: As you collect data, keep an eye on your response demographics. Are you getting a good mix of respondents? If not, you may need to send targeted reminders to underrepresented groups.
- Clean and Adjust Post-Survey: Don’t take the raw data at face value. Check for imbalances. If your sample’s demographics (e.g., age, location, customer type) don’t match your population’s, apply weighting to correct it.
Read More
Understanding the Impact of Sample Size on Survey Results

Tired of Survey Silence? Your 2025 Step-by-Step Guide to Improving Survey Participation

Insider Tips for Successful Online Surveys: The Ultimate 2025 Guide
The Bottom Line: From Guesswork to Confidence
Sampling error can feel like a technical, academic concept, but its effects are very real. It can lead to misguided business strategies, failed product launches, and a fundamental misunderstanding of your customers.
By moving beyond basic methods and thoughtfully applying advanced strategies like stratified sampling, cluster sampling, and post-survey weighting, you change the game. You move from hoping your data is right to actively building a process that produces more reliable, accurate, and defensible results.
The goal isn’t to eliminate sampling error entirely—that’s only possible if you survey everyone. The goal is to understand it, manage it, and reduce it to a point where you can trust the decisions you make based on your data. Your next survey doesn’t have to be a shot in the dark. With these strategies, you can build a clearer picture of what your audience truly thinks.