Have you ever spent hours crafting what you thought was the perfect online survey, only to be met with low response rates and incomplete answers? You’re not alone. Many businesses and researchers struggle with getting meaningful insights from their surveys because they aren’t measuring the right things.
Understanding user engagement isn’t just about how many people clicked on your survey—it’s about how they interacted with it, how much time they spent, and whether they found it worthwhile. In this blog, we’ll walk through the key metrics you should track to evaluate user engagement in online surveys. By the end, you’ll know exactly what to measure and how to use that data to make your surveys more effective.
Table of Contents
Why Measuring User Engagement Matters?
Before we get into the specifics, let’s talk about why user engagement is so important. If people aren’t engaged with your survey, they’re likely to drop off, rush through answers, or provide low-quality responses. This means you’re not getting the insights you need, and you’ve wasted time and resources.
By tracking engagement, you can:
- Identify where respondents lose interest.
- Improve survey design to keep people involved.
- Gather higher-quality data for better decision-making.
Let’s break down the metrics that matter most.
1. Survey Completion Rate
What It Is:
The percentage of people who started your survey and finished it.
Why It Matters:
A low completion rate often means your survey is too long, confusing, or simply not engaging enough. If people are dropping off halfway, you’re missing out on valuable data.
How to Improve It:
- Keep surveys short and focused.
- Use progress bars to show respondents how much is left.
- Avoid complex or repetitive questions.
2. Time Spent on Survey
What It Is:
The average amount of time respondents spend completing your survey.
Why It Matters:
If people are spending too little time, they might be rushing through without thinking. If they’re spending too much, the survey might be too difficult or boring.
How to Improve It:
- Aim for a sweet spot—typically 5-10 minutes for most surveys.
- Test your survey with a small group to see how long it takes.
- Simplify questions that take too long to answer.

3. Drop-off Points
What It Is:
The specific questions or sections where respondents abandon the survey.
Why It Matters:
Identifying drop-off points helps you pinpoint problem areas. Maybe a question is too personal, too confusing, or just poorly worded.
How to Improve It:
- Review questions where drop-offs are high.
- Reword or remove problematic questions.
- Use skip logic to avoid irrelevant sections.
4. Click-through Rate (CTR)
What It Is:
The percentage of people who clicked on your survey link after seeing it.
Why It Matters:
A low CTR means your survey invitation isn’t compelling enough. People won’t engage if they don’t see the value.
How to Improve It:
- Write clear and inviting subject lines or headlines.
- Explain why the survey matters and how it benefits respondents.
- Offer incentives like discounts or entry into a prize draw.

5. Response Quality
What It Is:
How thoughtful and accurate the answers are. This can be measured by looking at open-ended responses, consistency in answers, or lack of straight lining (selecting the same answer for every question).
Why It Matters:
Poor response quality means your data isn’t reliable. You might end up making decisions based on flawed insights.
How to Improve It:
- Use attention-check questions to filter out careless respondents.
- Keep surveys engaging to encourage thoughtful answers.
- Avoid leading or biased questions.
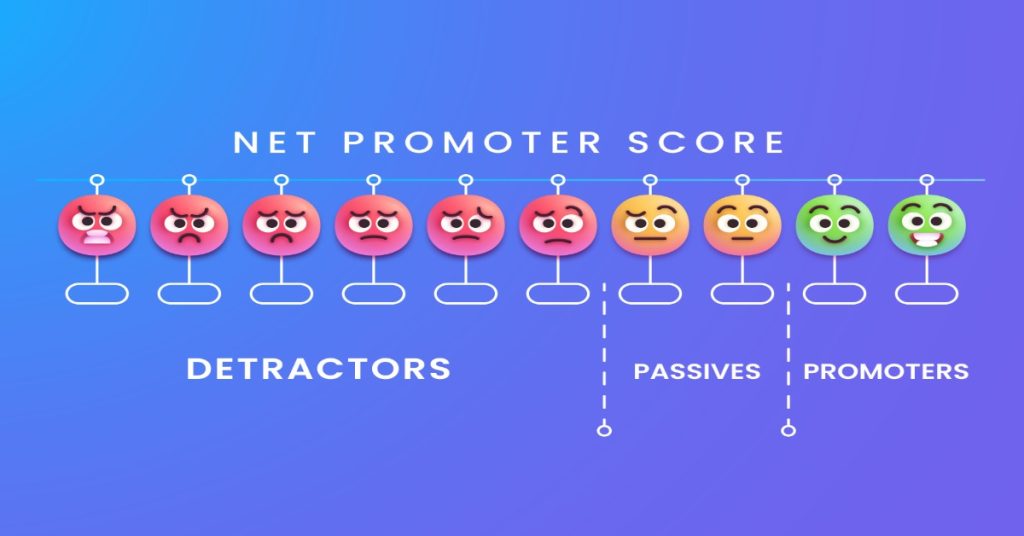
6. Net Promoter Score (NPS) for Survey Experience
What It Is:
A metric that measures how likely respondents are to recommend your survey to others.
Why It Matters:
If people enjoy taking your survey, they’re more likely to participate in future ones and provide honest feedback.
How to Improve It:
- Make the survey visually appealing and easy to navigate.
- Thank respondents and show appreciation for their time.
- Act on feedback to show respondents their input matters.

7. Device and Platform Analytics
What It Is:
Data on what devices (mobile, desktop, tablet) and platforms respondents use to complete your survey.
Why It Matters:
If your survey isn’t mobile-friendly, you could be losing a huge portion of your audience. People are more likely to engage if the survey works well on their device.
How to Improve It:
- Test your survey on different devices and browsers.
- Use responsive design to ensure it looks good on all screens.
- Simplify questions for mobile users to make tapping and scrolling easier.
Putting It All Together
Now that you know which metrics to track, the next step is to use this data to make your surveys better. Here’s a simple process:
- Set benchmarks: Know what “good” looks like for your surveys.
- Monitor regularly: Check these metrics every time you send a survey.
- Iterate and improve: Use the insights to refine your approach.
Remember, the goal isn’t just to collect data—it’s to collect meaningful data that helps you make informed decisions.
Read More
A Step-by-Step Guide to Using Survey Tools: Get Better Results Every Time

Effective Survey Design Techniques to Improve User Engagement

Comparing Different Online Survey Platforms
Final Thoughts
Creating engaging surveys isn’t rocket science, but it does require attention to detail. By focusing on these key metrics, you can transform your surveys from ignored nuisances into valuable tools for insight.
Start applying these tips today, and watch your response rates and data quality improve. Happy surveying!

