Data analysis is full of terms that sound similar but mean very different things. Two of the most commonly confused concepts are correlation and regression. If you’ve ever wondered how they differ or when to use each, you’re not alone. Many data analysts struggle with understanding these concepts clearly.
This blog will break down correlation vs regression in simple terms, explain their key differences, and show you when to use each method. By the end, you’ll have a solid grasp of both—helping you make better data-driven decisions.
Why Understanding Correlation and Regression Matters
Before jumping into definitions, let’s address a common pain point:
- Have you ever assumed that because two variables are related, one must cause the other?
- Have you struggled to predict future trends because you weren’t sure which analysis method to use?
These are real challenges in data analysis. Misusing correlation and regression can lead to wrong conclusions, poor business decisions, and flawed predictions.
The good news? Once you understand the difference, you’ll avoid these mistakes and improve your analysis skills.
What Is Correlation?
Correlation measures how strongly two variables are related. It tells us:
- Direction: Do the variables move in the same or opposite directions?
- Strength: How closely do they follow each other?
Types of Correlation
- Positive Correlation – Both variables increase together (e.g., study time and exam scores).
- Negative Correlation – One variable increases while the other decreases (e.g., exercise and weight loss).
- No Correlation – No clear relationship exists (e.g., shoe size and IQ).
How to Measure Correlation
The most common measure is the Pearson Correlation Coefficient (r), ranging from -1 to 1:
- +1: Perfect positive correlation
- -1: Perfect negative correlation
- 0: No correlation
Example:
If ice cream sales increase with temperature, the correlation might be r = 0.8 (a strong positive relationship).
Limitations of Correlation
- Does not imply causation – Just because two things move together doesn’t mean one causes the other.
- Only measures linear relationships – It may miss complex patterns.
What Is Regression?
While correlation tells us if a relationship exists, regression helps us predict outcomes. It models the relationship between a dependent variable (outcome) and one or more independent variables (predictors).
Types of Regression
- Simple Linear Regression – One independent variable predicts one dependent variable.
- Multiple Regression – Multiple independent variables predict one dependent variable.
- Logistic Regression – Used when the outcome is binary (yes/no, true/false).
How Regression Works
Regression finds the best-fit line (or curve) that explains how changes in X affect Y. The equation for simple linear regression is:
Y = a + bX + e
Where:
- Y = Dependent variable
- X = Independent variable
- a = Intercept (value of Y when X = 0)
- b = Slope (how much Y changes per unit change in X)
- e = Error term
Example:
Predicting house prices (Y) based on square footage (X). The regression line helps estimate price changes as size increases.
Why Use Regression?
- Predict future values (e.g., sales forecasts).
- Understand the impact of variables (e.g., how advertising spend affects revenue).
- Test hypotheses (e.g., does training improve employee performance?).
Limitations of Regression
- Assumes a linear relationship (unless using non-linear models).
- Sensitive to outliers (extreme values can skew results).
- Requires careful variable selection (including irrelevant variables reduces accuracy).
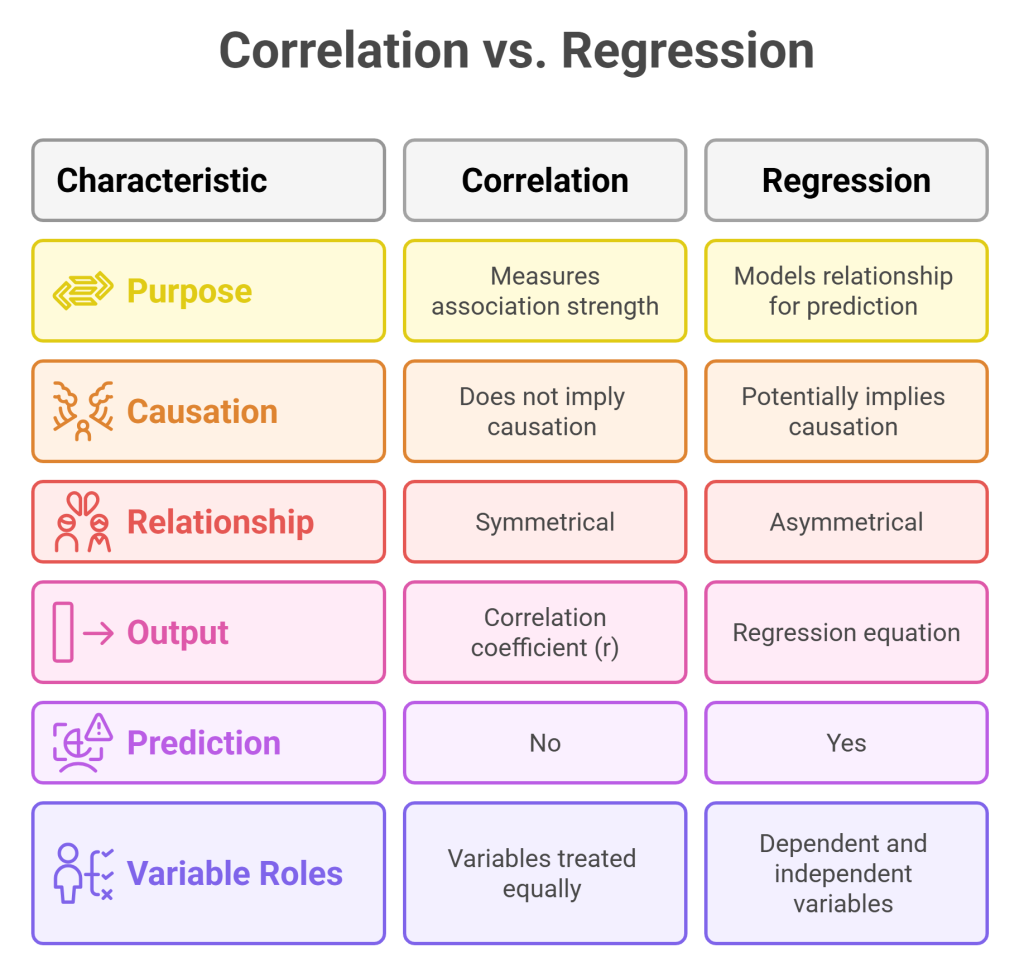
Key Differences Between Correlation and Regression
| Feature | Correlation | Regression |
| Purpose | Measures relationship strength | Predicts outcomes |
| Dependency | No dependent/independent variables | One dependent, one or more independent variables |
| Output | Coefficient (-1 to +1) | Equation (Y = a + bX) |
| Causality | Does not imply causation | Can suggest causation if properly tested |
| Usage | Initial exploratory analysis | Predictive modeling |
When to Use Correlation vs Regression
Use Correlation When:
✔ You want to check if two variables are related.
✔ You need a quick measure of association.
✔ You’re in the early stages of data exploration.
Use Regression When:
✔ You need to predict future values.
✔ You want to quantify how variables influence each other.
✔ You’re testing cause-and-effect relationships (with caution).
Common Mistakes to Avoid
- Assuming Correlation Means Causation
- Just because ice cream sales and drowning incidents both rise in summer doesn’t mean ice cream causes drownings. A third factor (hot weather) may be the real cause.
- Just because ice cream sales and drowning incidents both rise in summer doesn’t mean ice cream causes drownings. A third factor (hot weather) may be the real cause.
- Ignoring Non-Linear Relationships
- Correlation only captures linear trends. Always visualize data to spot curves or other patterns.
- Correlation only captures linear trends. Always visualize data to spot curves or other patterns.
- Overfitting Regression Models
- Adding too many variables can make the model fit past data well but fail in real-world predictions.
Read More
A Guide to Different Types of Questionnaires for Research

Descriptive vs Analytical Research

Workshop Feedback Sample
Final Thoughts: Choosing the Right Tool
Both correlation and regression are essential in data analysis, but they serve different purposes:
- Correlation answers: “Are these two variables related?”
- Regression answers: “Can I predict Y based on X?”
By understanding the differences between correlation and regression, you’ll make better decisions, avoid common pitfalls, and improve your analytical skills.