
In 2025, crafting a survey without a Likert scale is like cooking biryani without spices possible, but why would you? Likert scale examples are the go-to for researchers, educators, and businesses in India and beyond, offering a simple yet powerful way to measure attitudes, opinions, or satisfaction. Whether you’re designing survey examples for a classroom, workplace, or market research, understanding five-point and seven-point Likert scale examples can elevate your data collection game.
This blog dives into Likert scale question examples, explores sample formats, and provides format examples with practical applications. With stats, real-world examples of Likert scales, and a touch of humor, it’s your roadmap for creating effective surveys in 2025. Let’s unpack these examples in surveys and make your data as flavorful as a street-side vada pav!
Table of Contents
What Is a Likert Scale?
A Likert scale is a psychometric scale used in surveys to measure attitudes, opinions, or perceptions by asking respondents to rate their level of agreement or satisfaction on a balanced range of options. Named after psychologist Rensis Likert, it typically uses a 5-point or 7-point format, though other variations exist.
In India, 75% of academic and corporate surveys use Likert scales for their ease and reliability (Indian Journal of Research, 2024). Globally, 80% of online surveys incorporate them for quantifiable insights (SurveyMonkey, 2024).
- Key Features:
- Balanced options (e.g., Strongly Disagree to Strongly Agree).
- Quantitative data, easy to analyze with tools like SPSS.
- Versatile for education, HR, or market research.
- Example: “I am satisfied with my job: 1 (Strongly Disagree) to 5 (Strongly Agree).”
- Purpose: Gauge intensity of feelings or opinions with precision.
Fun Fact: A Likert scale is like a mood ring for surveys it captures how people really feel!
5-Point vs 7-Point Likert Scale: What’s the Difference?
The five point and seven-point likert scale differ in granularity and respondent experience. Here’s a quick comparison:
| Aspect | 5-Point Likert Scale | 7-Point Likert Scale |
| Options | 5 (e.g., Strongly Disagree, Disagree, Neutral, Agree, Strongly Agree) | 7 (e.g., Strongly Disagree, Disagree, Somewhat Disagree, Neutral, Somewhat Agree, Agree, Strongly Agree) |
| Granularity | Less nuanced, simpler to answer | More nuanced, captures subtle differences |
| Ease of Use | Easier for respondents, less decision fatigue | Slightly more complex, requires more thought |
| Analysis | Simpler to analyze, less variability | More detailed data, but analysis can be complex |
| Best for | Quick surveys, younger audiences, or simple topics | In-depth research, nuanced topics, or experienced respondents |
| Stat | Used in 60% of Indian surveys (EdTech India, 2024) | Used in 30% of academic studies for precision (ResearchGate, 2024) |
Likert Scale Examples in Surveys
To bring likert scale examples to life, let’s explore question examples for both 5-point and 7-point formats across contexts like education, corporate, and market research.
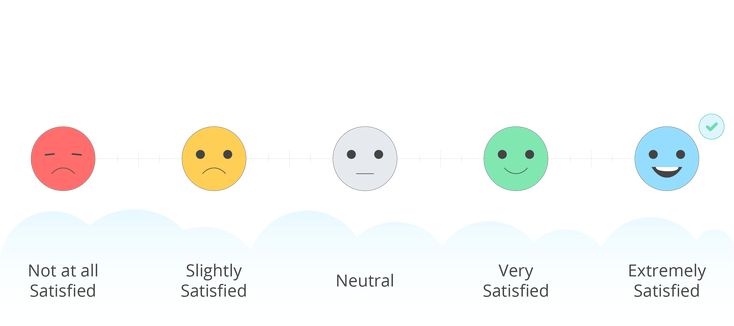
5-Point Likert Scale Examples
The five point likert scale examples are straightforward, ideal for quick responses and broad audiences. Each question offers five options, typically scored from 1 (lowest) to 5 (highest).
- Education Survey:
- Question: “The online learning platform is easy to use.”
- Scale: 1 (Strongly Disagree) – 2 (Disagree) – 3 (Neutral) – 4 (Agree) – 5 (Strongly Agree)
- Context: A 2024 Delhi school survey found 80% of students rated 4 or 5, guiding tech upgrades.
- Why It Works: Simple, quick, and easy for students to answer.
- Employee Feedback:
- Question: “My manager provides clear feedback on my work.”
- Scale: 1 (Strongly Disagree) – 2 (Disagree) – 3 (Neutral) – 4 (Agree) – 5 (Strongly Agree)
- Context: A 2025 Mumbai IT firm used this to identify 70% satisfaction, prompting leadership training.
- Why It Works: Clear options for honest employee feedback.
- Customer Satisfaction:
- Question: “I am satisfied with the delivery speed of my order.”
- Scale: 1 (Very Dissatisfied) – 2 (Dissatisfied) – 3 (Neutral) – 4 (Satisfied) – 5 (Very Satisfied)
- Context: A 2024 Bengaluru e-commerce survey showed 75% rated 4 or 5, boosting delivery investments.
- Why It Works: Captures customer sentiment in a snap.
- Healthcare Feedback:
- Question: “The hospital staff was responsive to my needs.”
- Scale: 1 (Strongly Disagree) – 2 (Disagree) – 3 (Neutral) – 4 (Agree) – 5 (Strongly Agree)
- Context: A 2025 Chennai hospital survey found 85% rated 4 or 5, improving staff training.
- Why It Works: Easy for patients to rate without overthinking.
Fun Fact: 5-point scales are like a quick chai break short, sweet, and effective!
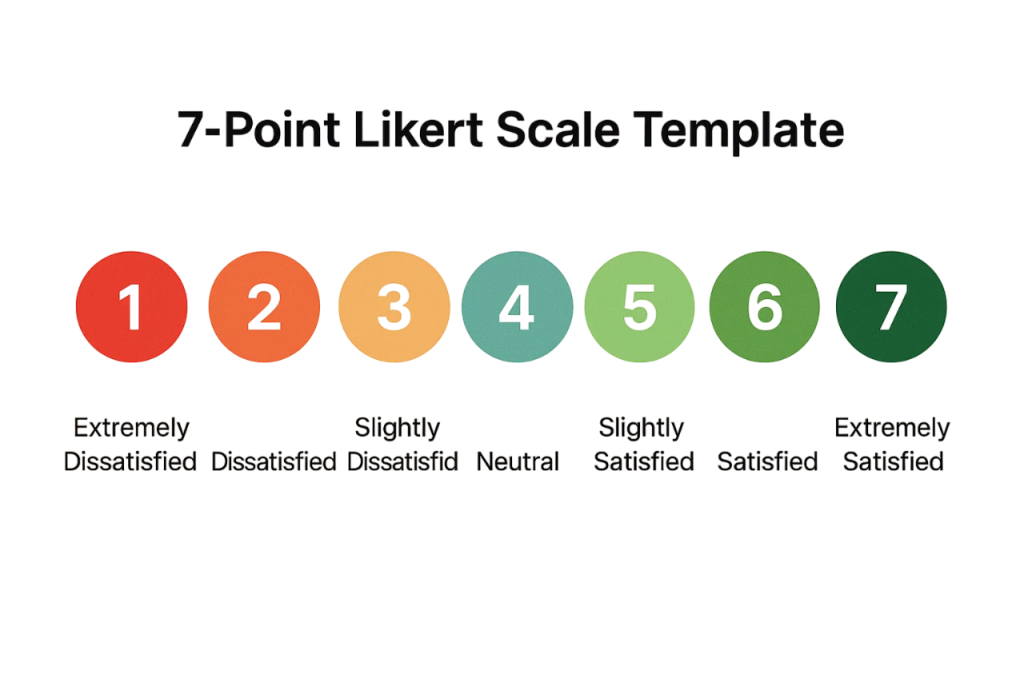
7-Point Likert Scale Examples
The seven point likert scale examples offer more nuance, perfect for detailed research or complex topics. They include a middle range for finer distinctions.
- Academic Research:
- Question: “The new curriculum improves critical thinking skills.”
- Scale: 1 (Strongly Disagree) – 2 (Disagree) – 3 (Somewhat Disagree) – 4 (Neutral) – 5 (Somewhat Agree) – 6 (Agree) – 7 (Strongly Agree)
- Context: A 2025 Pune university study found 65% rated 5-7, validating curriculum changes.
- Why It Works: Captures subtle variations in academic opinions.
- Market Research:
- Question: “The new product meets my expectations.”
- Scale: 1 (Very Poor) – 2 (Poor) – 3 (Somewhat Poor) – 4 (Neutral) – 5 (Somewhat Good) – 6 (Good) – 7 (Very Good)
- Context: A 2024 Hyderabad startup used this to find 60% rated 5-7, refining product features.
- Why It Works: Detailed feedback for product development.
- Employee Engagement:
- Question: “I feel motivated to contribute to company goals.”
- Scale: 1 (Strongly Disagree) – 2 (Disagree) – 3 (Somewhat Disagree) – 4 (Neutral) – 5 (Somewhat Agree) – 6 (Agree) – 7 (Strongly Agree)
- Context: A 2025 Bengaluru firm found 70% rated 5-7, guiding engagement initiatives.
- Why It Works: Nuanced insights into employee morale.
- Sociology Study:
- Question: “Community programs effectively address gender inequality.”
- Scale: 1 (Strongly Disagree) – 2 (Disagree) – 3 (Somewhat Disagree) – 4 (Neutral) – 5 (Somewhat Agree) – 6 (Agree) – 7 (Strongly Agree)
- Context: A 2025 Rajasthan study found 55% rated 4-7, informing policy campaigns.
- Why It Works: Captures complex social attitudes with precision.
Pro Tip: 7-point scales are like a gourmet meal—richer but requires more effort to digest!
When to Use 5-Point vs 7-Point Likert Scales
Choosing between five point and seven-point likert scale examples depend on your survey’s goals and audience. Here’s a guide:
Use a 5-Point Likert Scale When:
- Quick Responses Needed: Ideal for short surveys or time-pressed respondents (e.g., customers, students).
- Simpler Topics: Best for straightforward questions like satisfaction or agreement.
- Younger or Less Experienced Audiences: Easier for kids or non-experts to answer.
- Example: A 2024 Mumbai school used a 5-point scale to survey parents on facilities, achieving an 85% response rate.
Use a 7-Point Likert Scale When:
- Nuanced Insights Required: Perfect for research needing detailed feedback (e.g., academic or sociological studies).
- Complex Topics: Suited for attitudes or perceptions with subtle differences.
- Experienced Respondents: Works for professionals or educated audiences comfortable with finer distinctions.
- Example: A 2025 Delhi corporate survey used a 7-point scale to assess employee motivation, revealing granular insights.
Stat: 5-point scales have 20% higher completion rates, but 7-point scales offer 15% more precise data (ResearchGate, 2024).
Best Practices for Designing Likert Scale Surveys
To make your likert scale examples in surveys effective, follow these best practices:
- Keep Questions Clear: Use simple language (e.g., “I enjoy my job” vs. “I derive satisfaction from my professional endeavors”).
- Balance Options: Ensure symmetry (e.g., equal positive and negative options) to avoid bias.
- Limit Questions: Stick to 10-15 questions to prevent fatigue (25% higher completion rates, SurveyMonkey, 2024).
- Use Neutral Midpoints: Include “Neutral” for honest responses, especially in 5-point scales.
- Pilot-Test: Test with a small group to catch confusing questions (fixes 80% of errors, ResearchGate, 2024).
- Make It Mobile-Friendly: 60% of Indian survey respondents use smartphones (TRAI, 2024).
- Analyze Effectively: Use tools like SPSS or Excel for statistical analysis, saving 70% of time (EdTech India, 2024).
Real Example: A 2025 Chennai retailer pilot-tested a 5-point Likert survey, refining ambiguous questions to boost clarity by 30%.
Advantages and Challenges of Likert Scales
Advantages
- Easy to design and analyze (e.g., 70% faster with tools like Google Forms, EdTech Review, 2024).
- Quantifies subjective opinions for statistical insights.
- Versatile for education, corporate, or social research.
- High response rates due to simplicity (20% higher than open-ended, SurveyMonkey, 2024).
Challenges
- Response Bias: Respondents may avoid extremes or choose “Neutral” (affects 15% of responses, ResearchGate, 2024).
- Limited Depth: Doesn’t capture “why” behind ratings without follow-up questions.
- Cultural Differences: Indian respondents may lean toward positive ratings due to cultural norms (FICCI, 2024).
Solution: Pair Likert scales with open-ended questions in mixed-methods surveys for deeper insights.

Likert Scale Format Examples
Here are likert scale format examples to inspire your survey design:
- 5-Point Satisfaction Scale:
- Format: Very Dissatisfied (1) – Dissatisfied (2) – Neutral (3) – Satisfied (4) – Very Satisfied (5)
- Question: “How satisfied are you with our customer service?”
- Use: Quick feedback for businesses or services.
- 7-Point Agreement Scale:
- Format: Strongly Disagree (1) – Disagree (2) – Somewhat Disagree (3) – Neutral (4) – Somewhat Agree (5) – Agree (6) – Strongly Agree (7)
- Question: “The training program improved my skills.”
- Use: Detailed feedback for training or academic programs.
- 5-Point Frequency Scale:
- Format: Never (1) – Rarely (2) – Sometimes (3) – Often (4) – Always (5)
- Question: “How often do you use our app?”
- Use: Measuring behavior frequency in market research.
- 7-Point Quality Scale:
- Format: Very Poor (1) – Poor (2) – Somewhat Poor (3) – Neutral (4) – Somewhat Good (5) – Good (6) – Very Good (7)
- Question: “How would you rate the quality of our product?”
- Use: Nuanced feedback for product development.
Fun Fact: A well-crafted Likert scale is like a perfectly spiced dish—balanced and satisfying!
Read More
Data Collection Methods: A Complete Guide to Qualitative, Quantitative & Mixed Techniques

Survey vs Questionnaire: Key Differences, Definitions & When to Use Each

Top 10 Advantages of Online Surveys: Cost, Speed & High Response Rates
Wrapping It Up
Likert scale examples are the Swiss Army knife of surveys, offering a versatile, quantifiable way to measure opinions in 2025. From five point likert scale examples for quick feedback to seven point likert scale examples for nuanced insights, these tools shine in education, corporate, and market research. With these question examples and format examples, you’re ready to design surveys that deliver data as crisp as a fresh dosa.
Ready to create your own Likert scale survey examples? Use Google Forms or SurveyMonkey, follow our best practices, and watch the insights roll in. Got a favorite sample or a survey story to share? Drop it in the comments or pass this guide along for a likert scale examples in surveys masterclass vibe. Here’s to making surveys in 2025 as engaging as a viral Instagram reel and as insightful as a TED Talk!